 中国人文社会科学核心期刊
华东师范大学学报(教育科学版) ›› 2025, Vol. 43 ›› Issue (8): 30-50.doi: 10.16382/j.cnki.1000-5560.2025.08.003
马瑞克·科维克(Marek Kwiek)1, 卢卡斯·希穆拉(Lukasz Szymula)2
接受日期:2025-04-25
出版日期:2025-08-01
发布日期:2025-07-31
基金资助:Marek Kwiek1, Lukasz Szymula2
Accepted:2025-04-25
Online:2025-08-01
Published:2025-07-31
摘要:
采用基于队列的纵向研究设计,借助Scopus全球文献计量数据库,追踪分析了38个OECD国家科研人员截至2022年的科研发表数据,探讨了科学界成员是如何离开学术界的,以及科学人才流失在性别、学科领域和时间上的差异。研究涉及2000年(N=142,776)和2010年(N=232,843)开始发表论文的两批科研人员,覆盖科学、技术、工程、数学与医学(STEMM)领域的16个学科,以停止发表论文作为科研人员离开学术界的界定标准。研究显示:初次发表论文十年后,约50%的研究者仍保持学术活跃状态;当追踪周期延长至十九年后,该比例降至30%。通过生存分析法比较男女科学家的流失差异发现,随着女性在科学领域及同批次科研人员中占比的增加,人才流失的性别差异逐渐弱化。学科维度分析揭示,除了所有STEMM领域的整体变化外,具体学科层面的细微变化广泛存在。不同学科在科学人才流失上呈现出不同的性别差异;不同时间进入科学界的科研人员在流失概率上也存在差别。本研究验证了全球文献计量数据库在分析科学人才流失中的应用价值,并指出了原始结构化数据在学术职业的性别、年龄和学科等研究中的方法挑战和局限性。
马瑞克·科维克(Marek Kwiek), 卢卡斯·希穆拉(Lukasz Szymula). 科学人才流失模式:OECD国家研究格局的定量分析及方法论考量[J]. 华东师范大学学报(教育科学版), 2025, 43(8): 30-50.
Marek Kwiek, Lukasz Szymula. Patterns of Scientific Attrition: A Quantitative Analysis of Research Landscapes in OECD Countries with Methodological Considerations[J]. Journal of East China Normal University(Educationa, 2025, 43(8): 30-50.
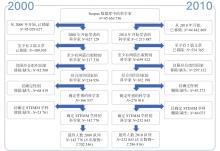
图 1
2000 年(左)和 2010 年(右)科学家群体的筛选过程"
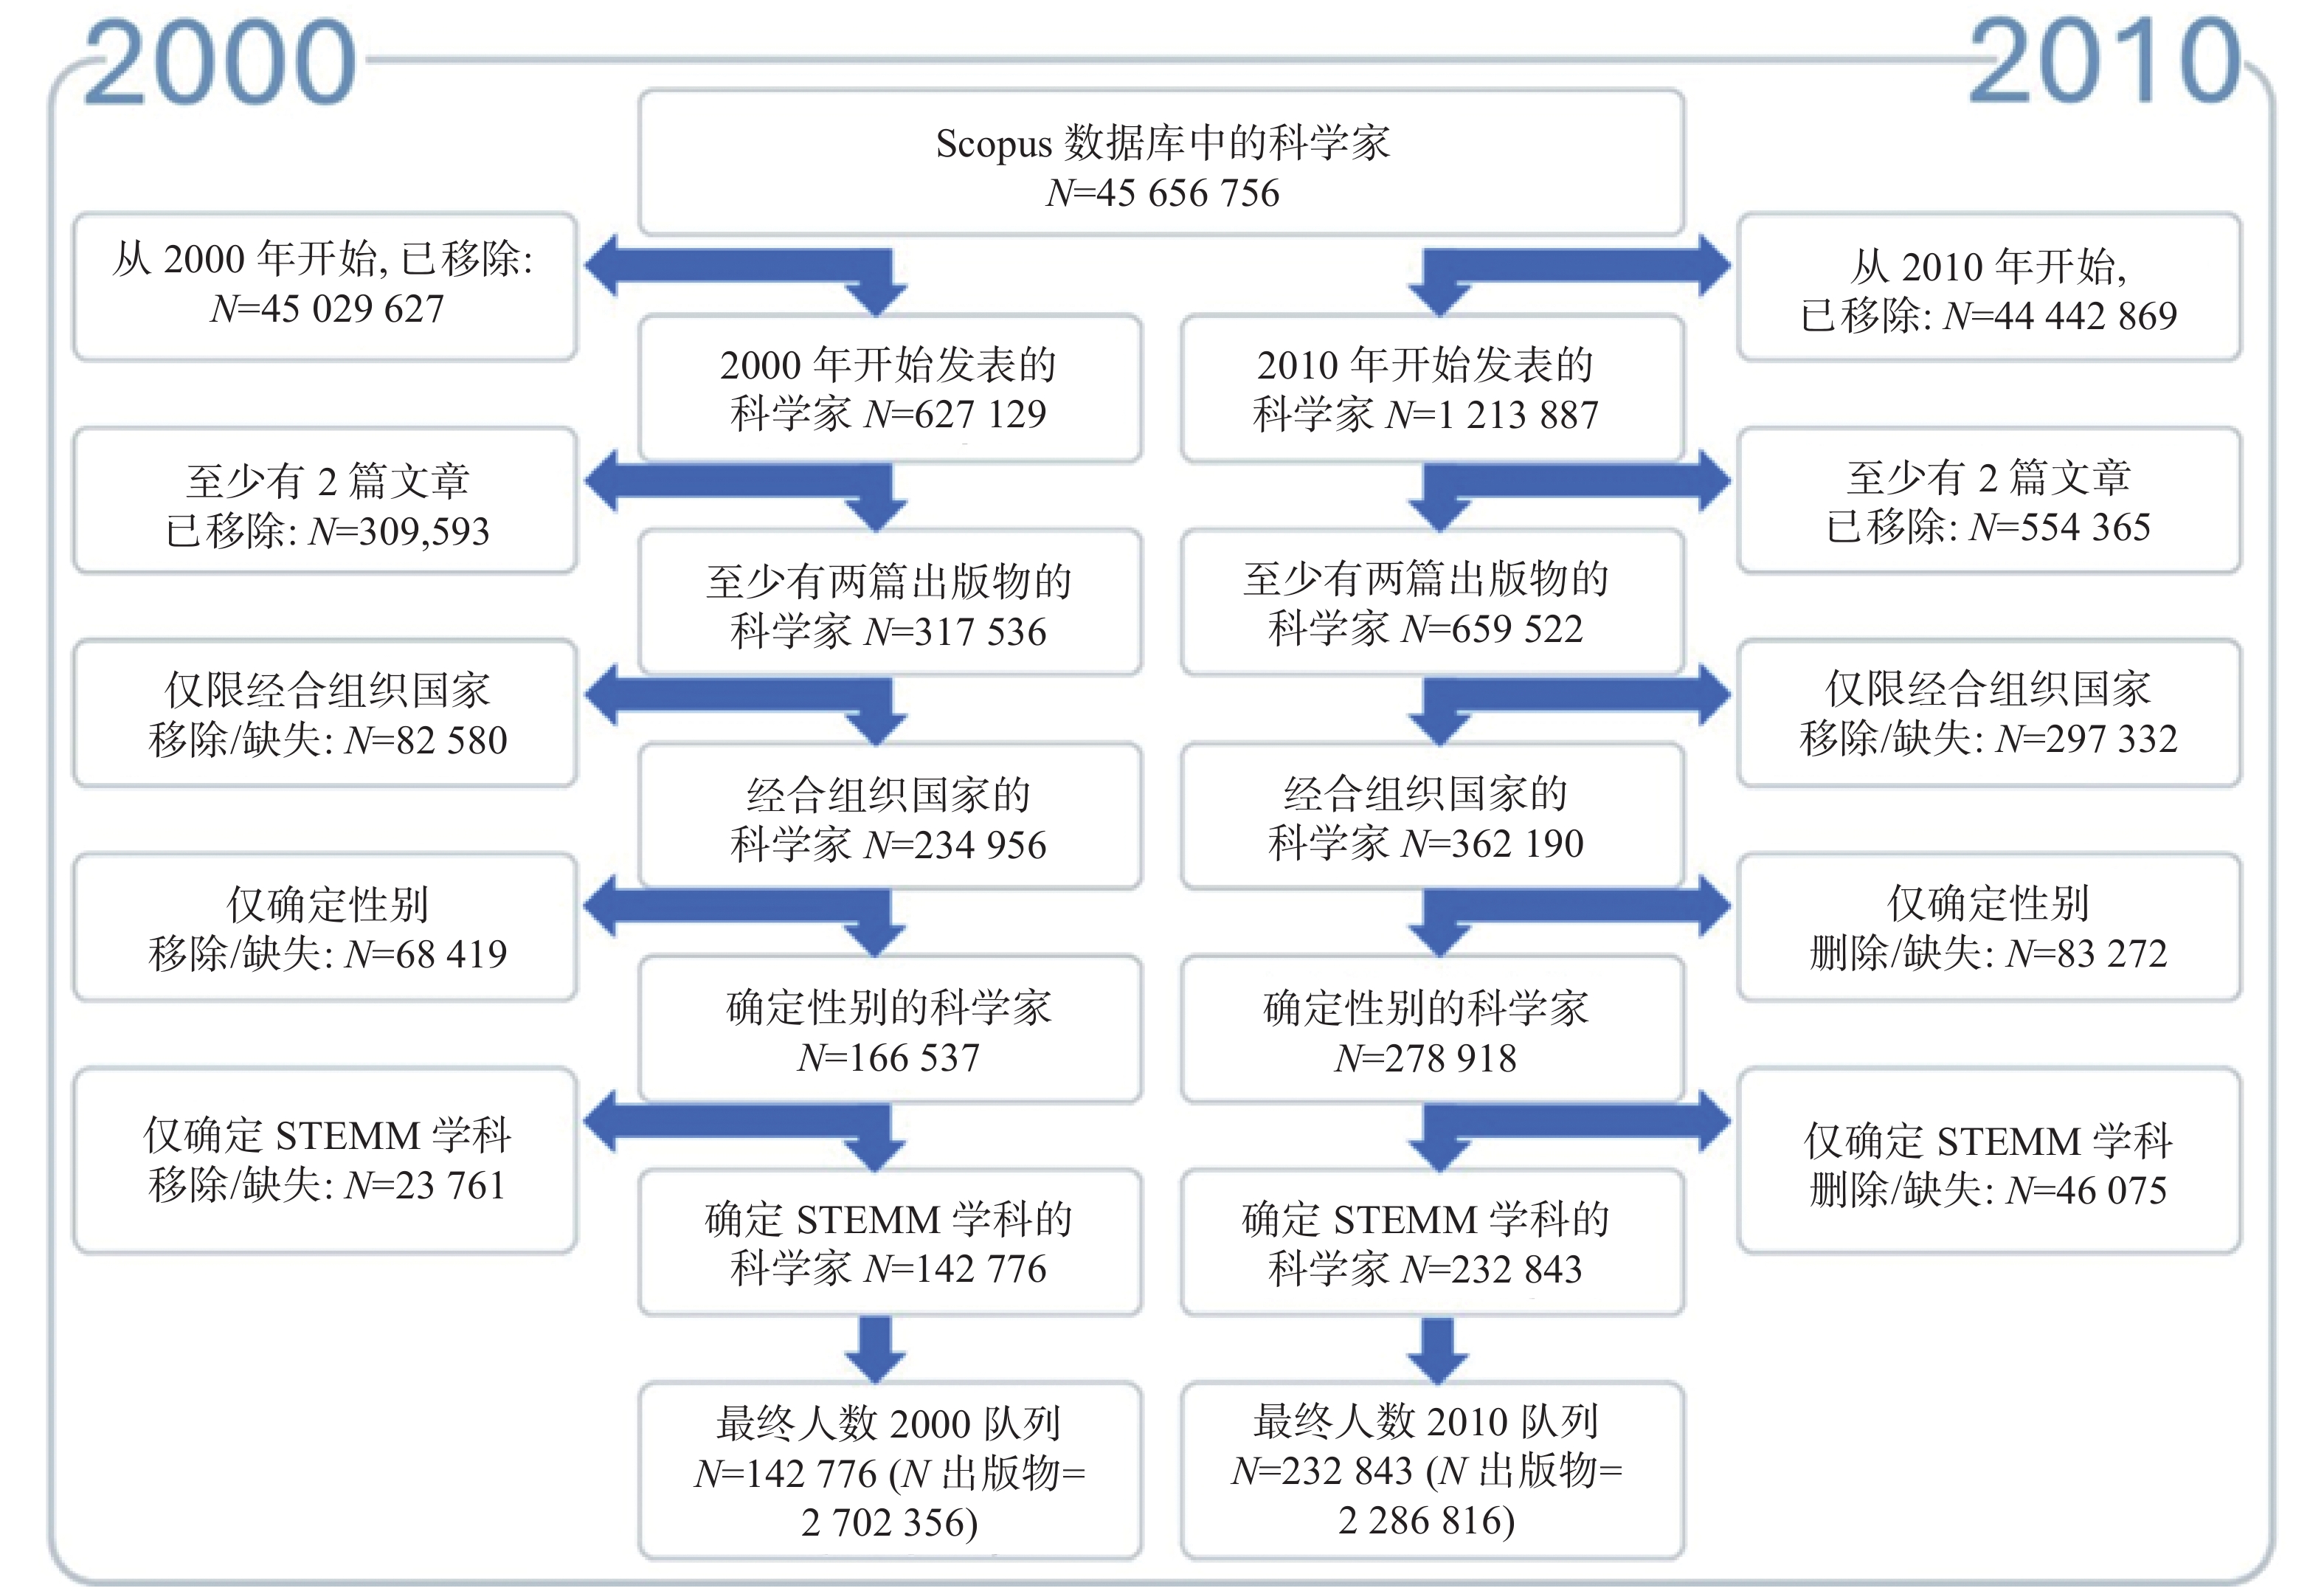

图 2
2000 年科学家队列(n=142,776)按性别分列的Kaplan-Meier生存曲线图"
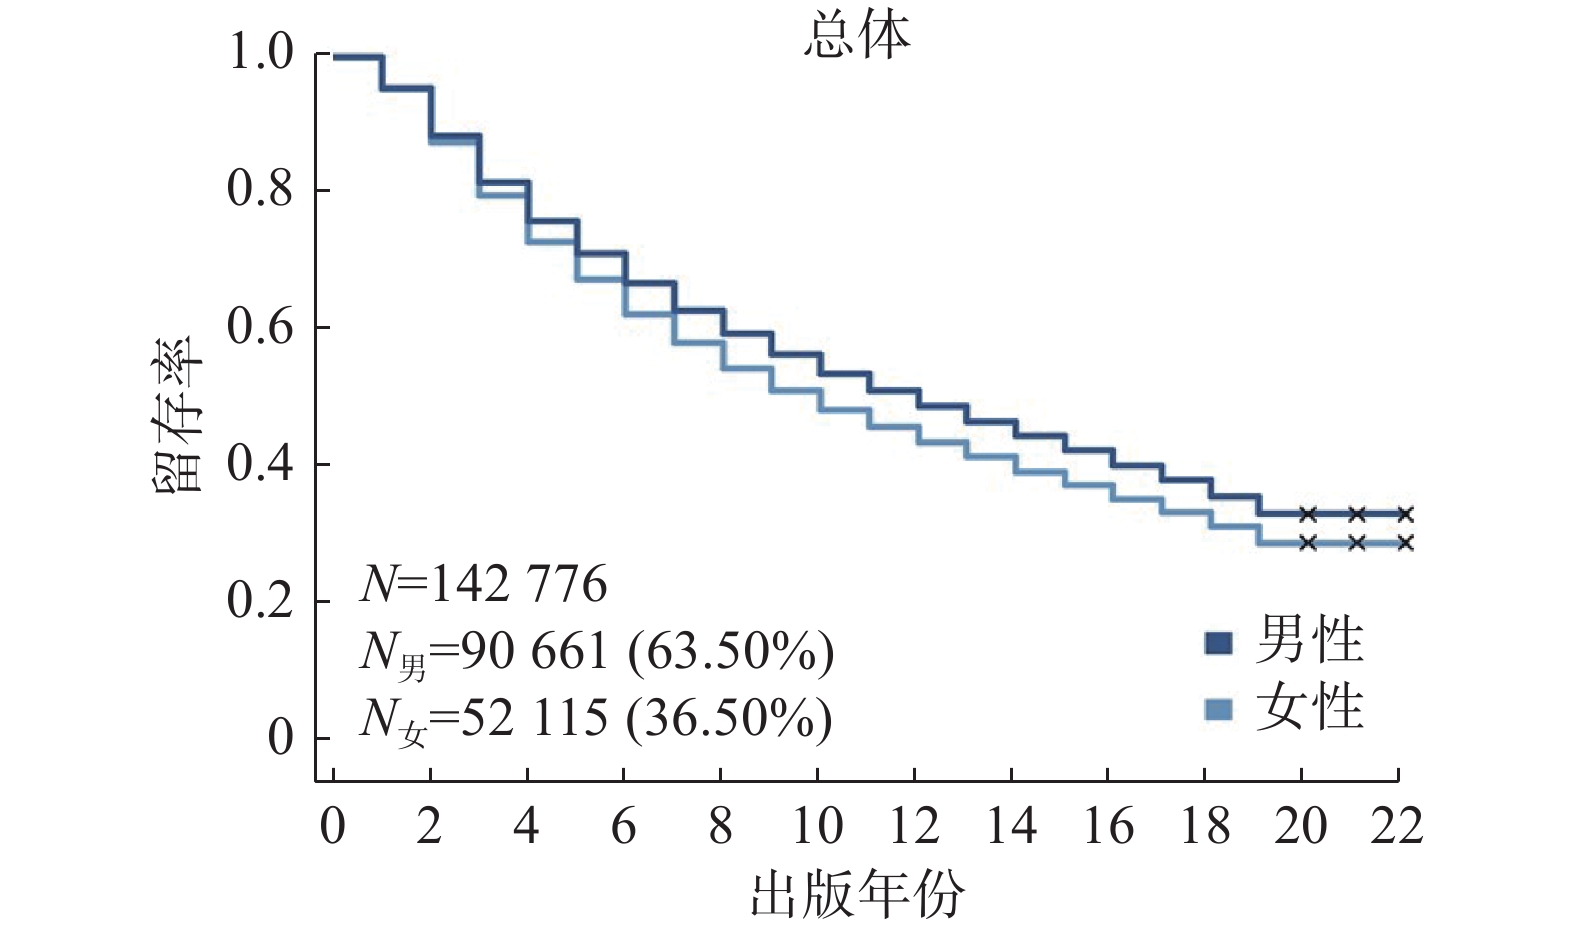
表 1
按性别分列的 2000 年科学家群体的Kaplan-Meier估计值(所有学科合计)"
| 时间 (年) | 女性(2000 年队列) | 男性(2000 年队列) | 总计(2000 年队列) | ||||||||
| N | N (离开 科学界) | KM 概率(停留) 及 95% CI 和 SE | N | N (离开 科学界) | KM 概率(停留) 及 95% CI 和 SE | N | N (离开 科学界) | KM 概率(停留) 及 95% CI 和 SE | |||
| 1 | 52,115 | 2,530 | 0.951 (0.950-0.953)1 | 90,661 | 4,151 | 0.954 (0.953-0.956)1 | 142,776 | 6,681 | 0.953 (0.951-0.954)1 | ||
| 2 | 49,585 | 3,985 | 0.875 (0.872-0.878)1 | 86,510 | 6,302 | 0.885 (0.883-0.887)1 | 136,095 | 10,287 | 0.880 (0.877-0.882)1 | ||
| 3 | 45,600 | 3,948 | 0.799 (0.796-0.803)2 | 80,208 | 6,114 | 0.817 (0.815-0.820)1 | 125,808 | 10,062 | 0.811 (0.809-0.812)1 | ||
| 4 | 41,652 | 3,553 | 0.731 (0.727-0.735)2 | 74,094 | 5,062 | 0.761 (0.759-0.764)1 | 115,746 | 8,615 | 0.749 (0.746-0.751)1 | ||
| 5 | 38,099 | 2,838 | 0.677 (0.673-0.681)2 | 69,032 | 4,356 | 0.713 (0.710-0.716)2 | 107,131 | 7,194 | 0.695 (0.691-0.698)2 | ||
| 6 | 35,261 | 2,602 | 0.627 (0.623-0.631)2 | 64,676 | 3,934 | 0.670 (0.667-0.673)2 | 99,937 | 6,536 | 0.655 (0.651-0.658)2 | ||
| 7 | 32,659 | 2,183 | 0.585 (0.581-0.589)2 | 60,742 | 3,458 | 0.632 (0.629-0.635)2 | 93,401 | 5,641 | 0.613 (0.610-0.616)2 | ||
| 8 | 30,476 | 1,961 | 0.547 (0.543-0.551)2 | 57,284 | 3,110 | 0.598 (0.594-0.601)2 | 87,760 | 5,071 | 0.577 (0.574-0.580) 2 | ||
| 9 | 28,515 | 1,665 | 0.515 (0.511-0.520) 2 | 54,174 | 2,774 | 0.567 (0.564-0.570)2 | 82,689 | 4,439 | 0.548 (0.545-0.551)2 | ||
| 10 | 26,850 | 1,472 | 0.487 (0.483-0.491)2 | 51,400 | 2,465 | 0.540 (0.537-0.543)2 | 78,250 | 3,937 | 0.517 (0.514-0.520) 2 | ||
| 11 | 25,378 | 1,264 | 0.463 (0.458-0.467)2 | 48,935 | 2,225 | 0.515 (0.512-0.518) 2 | 74,313 | 3,489 | 0.492 (0.489-0.495)2 | ||
| 12 | 24,114 | 1,158 | 0.440 (0.436-0.445)2 | 46,710 | 2,055 | 0.493 (0.489-0.496)2 | 70,824 | 3,213 | 0.466 (0.463-0.469)2 | ||
| 13 | 22,956 | 1,151 | 0.418 (0.414-0.423)2 | 44,655 | 2,032 | 0.470 (0.467-0.473)2 | 67,611 | 3,183 | 0.444 (0.441-0.447)2 | ||
| 14 | 21,805 | 1,089 | 0.398 (0.393-0.402)2 | 42,623 | 1,889 | 0.449 (0.446-0.453)2 | 64,428 | 2,978 | 0.426 (0.423-0.429)2 | ||
| 15 | 20,716 | 1,048 | 0.377 (0.373-0.382)2 | 40,734 | 1,884 | 0.429 (0.425-0.432)2 | 61,450 | 2,932 | 0.405 (0.402-0.408)2 | ||
| 16 | 19,668 | 1,033 | 0.358 (0.353-0.362)2 | 38,850 | 1,959 | 0.407 (0.404-0.410)2 | 58,518 | 2,992 | 0.384 (0.381-0.387)2 | ||
| 17 | 18,635 | 1,002 | 0.338 (0.334-0.342)2 | 36,891 | 2,020 | 0.385 (0.381-0.388)2 | 55,526 | 3,022 | 0.363 (0.360-0.366)2 | ||
| 18 | 17,633 | 1,064 | 0.318 (0.314-0.322)2 | 34,871 | 2,070 | 0.362 (0.359-0.365)2 | 52,504 | 3,134 | 0.342 (0.339-0.345)2 | ||
| 19 | 16,569 | 1,228 | 0.294 (0.290-0.298) 2 | 32,801 | 2,350 | 0.336 (0.333-0.339)2 | 49,370 | 3,578 | 0.315 (0.312-0.318)2 | ||
图 3
2000 年科学家队列(N=142, 776)按学科和性别分列的Kaplan-Meier生存曲线图"
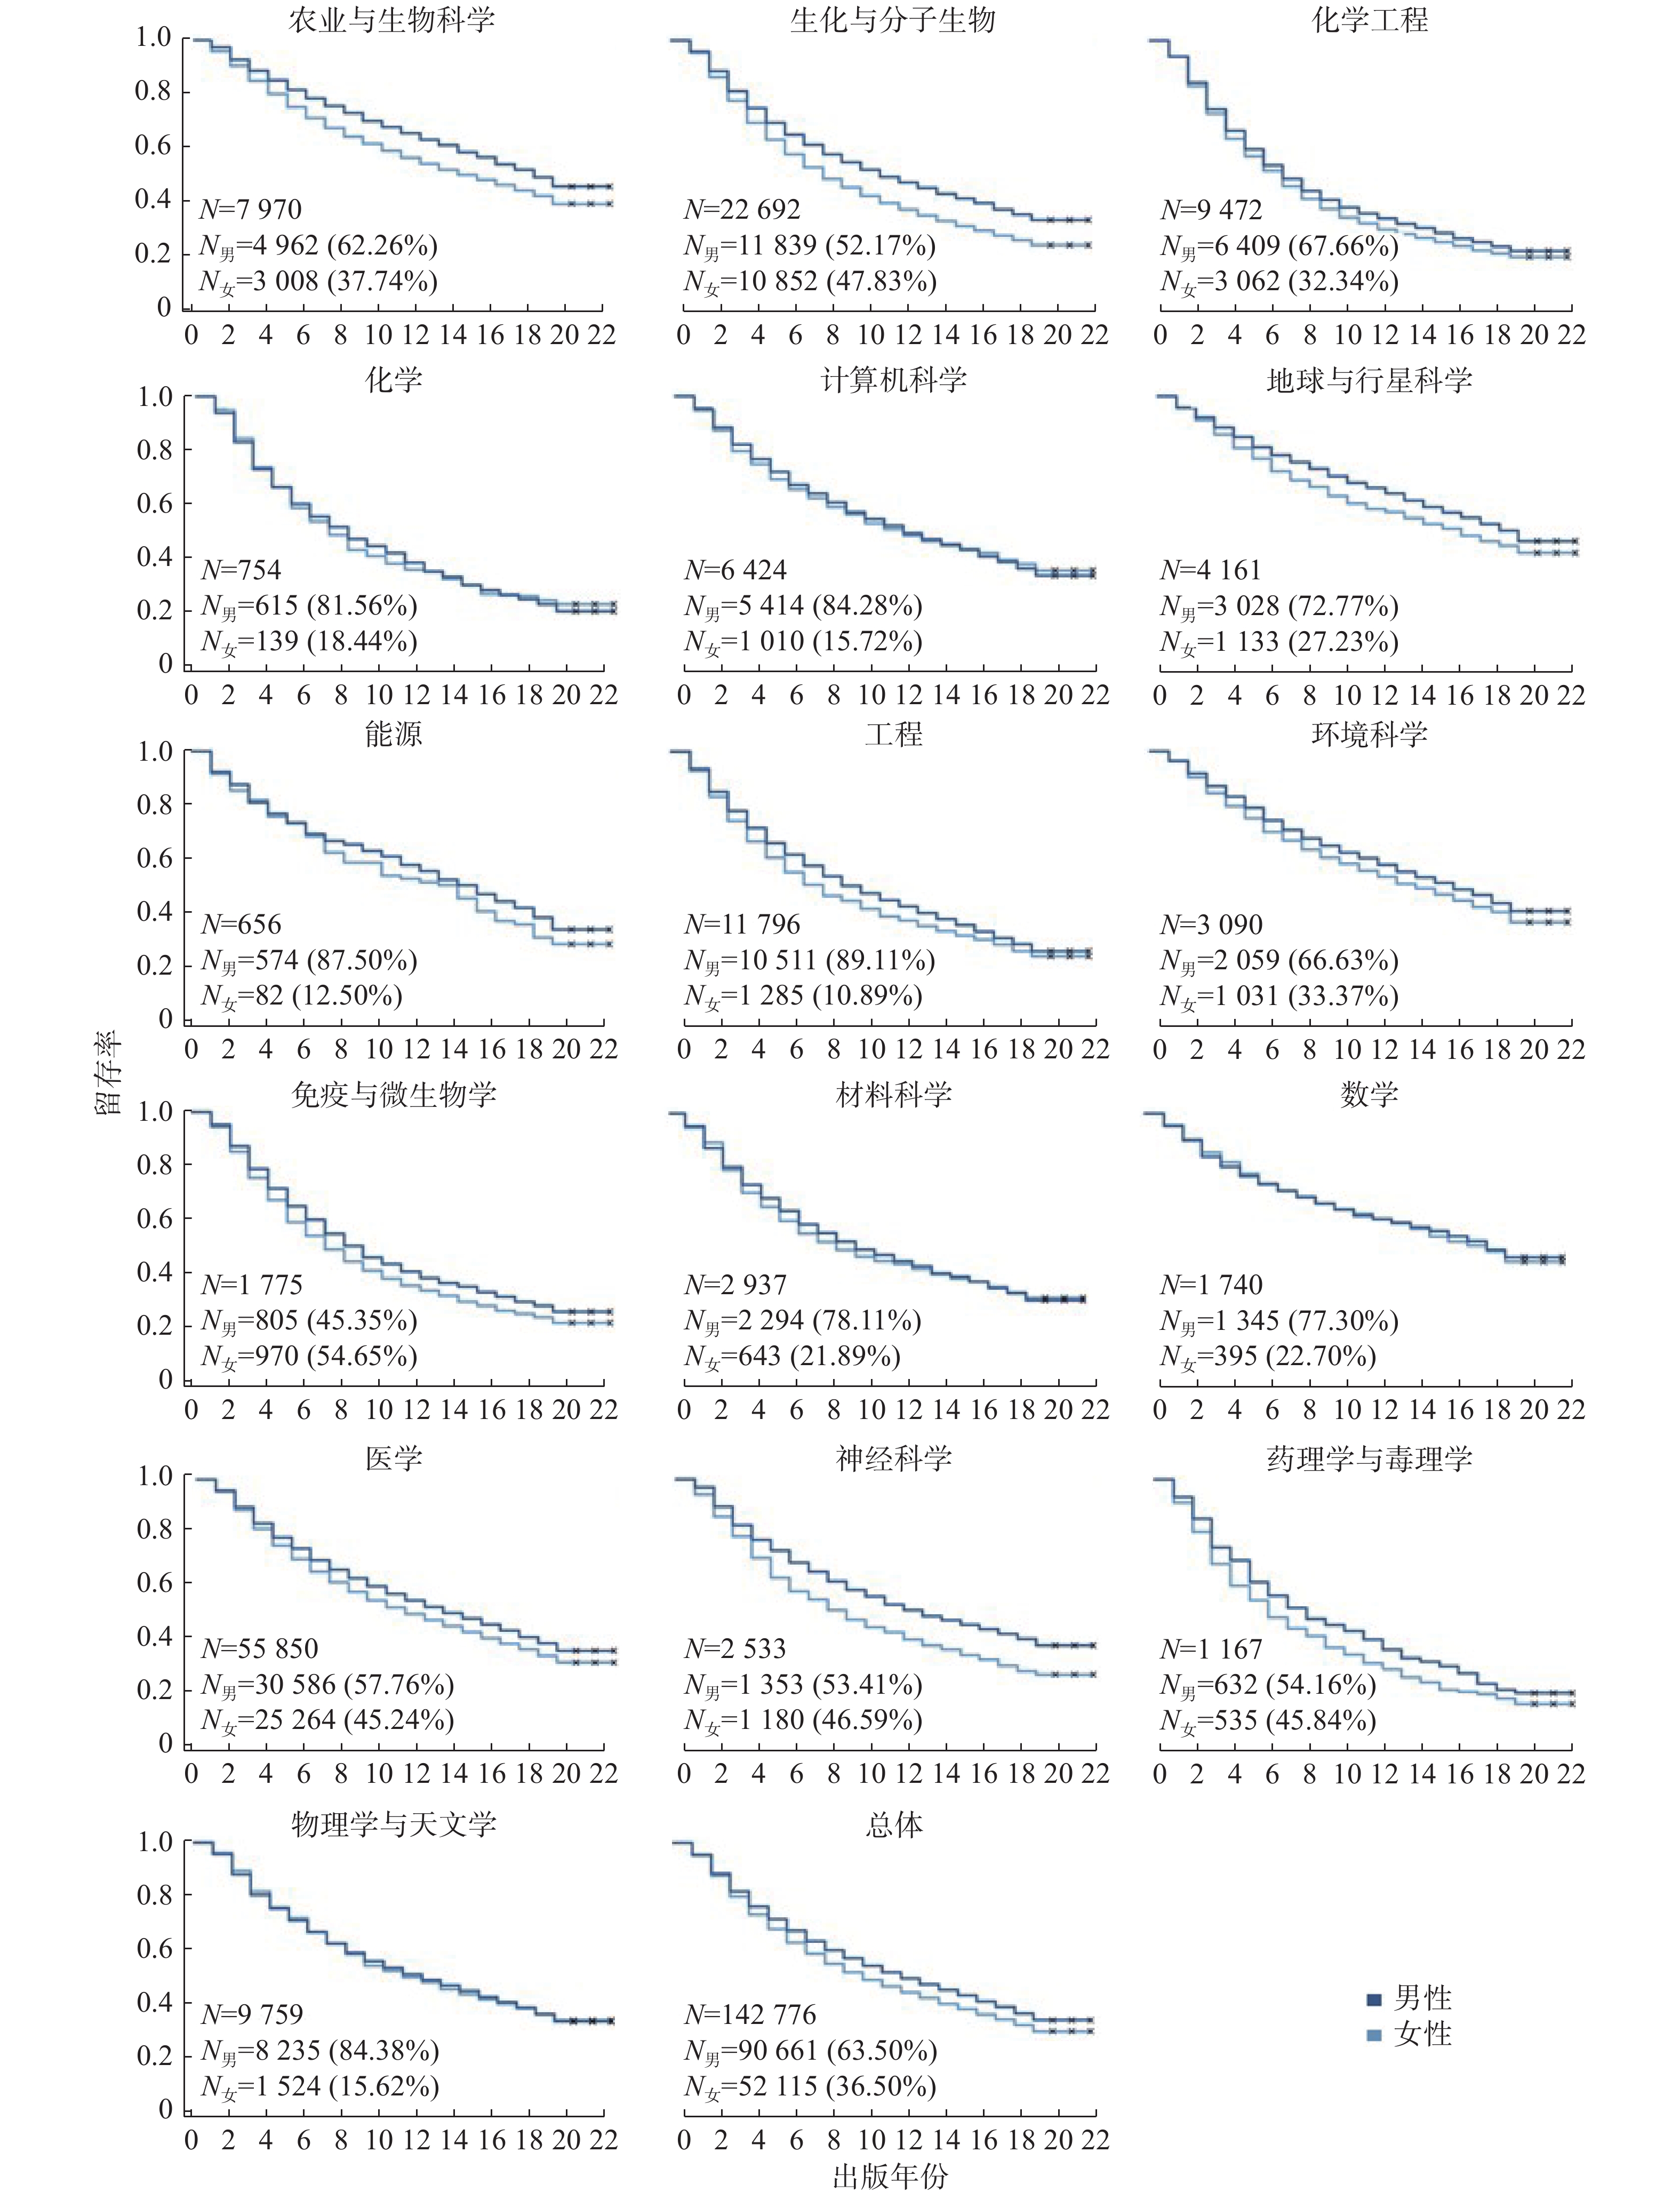
表 2
按性别分列的 2010 年科学家群体的Kaplan-Meier估计值(所有学科合计)"
| 时间 (年) | 女性(2010 年队列) | 男性(2010 年队列) | |||||
| N | N(离开科学界) | KM 概率(停留) 及 95% CI 和 SE | N | N(离开科学界) | KM 概率(停留) 及 95% CI 和 SE | ||
| 1 | 97,145 | 5,030 | 0.948 (0.947-0.950)1 | 135,698 | 7,375 | 0.946 (0.944-0.947)1 | |
| 2 | 92,115 | 8,686 | 0.859 (0.857-0.861)1 | 128,323 | 12,183 | 0.856 (0.854-0.858)1 | |
| 3 | 83,429 | 8,090 | 0.776 (0.773-0.778)1 | 116,140 | 11,164 | 0.774 (0.771-0.776)1 | |
| 4 | 75,339 | 7,369 | 0.700 (0.697-0.703)1 | 104,976 | 9,869 | 0.701 (0.698-0.703)1 | |
| 5 | 67,970 | 6,470 | 0.633 (0.630-0.636)2 | 95,107 | 8,552 | 0.638 (0.635-0.640)1 | |
| 6 | 61,500 | 5,904 | 0.572 (0.569-0.575)2 | 86,555 | 7,851 | 0.580 (0.577-0.583)1 | |
| 7 | 55,596 | 5,499 | 0.516 (0.513-0.519)2 | 78,704 | 7,322 | 0.526 (0.523-0.529)1 | |
| 8 | 50,097 | 4,984 | 0.464 (0.461-0.468)2 | 71,382 | 7,078 | 0.474 (0.471-0.477)1 | |
| 9 | 45,113 | 4,929 | 0.414 (0.411-0.417)2 | 64,304 | 6,745 | 0.424 (0.422-0.427)1 | |
图 4
2000 年科学家队列中按性别分列的Kaplan-Meier生存曲线图 生物化学与分子生物学(N=22,692,左图)与 物理与天文学(N=9,759,右图)"
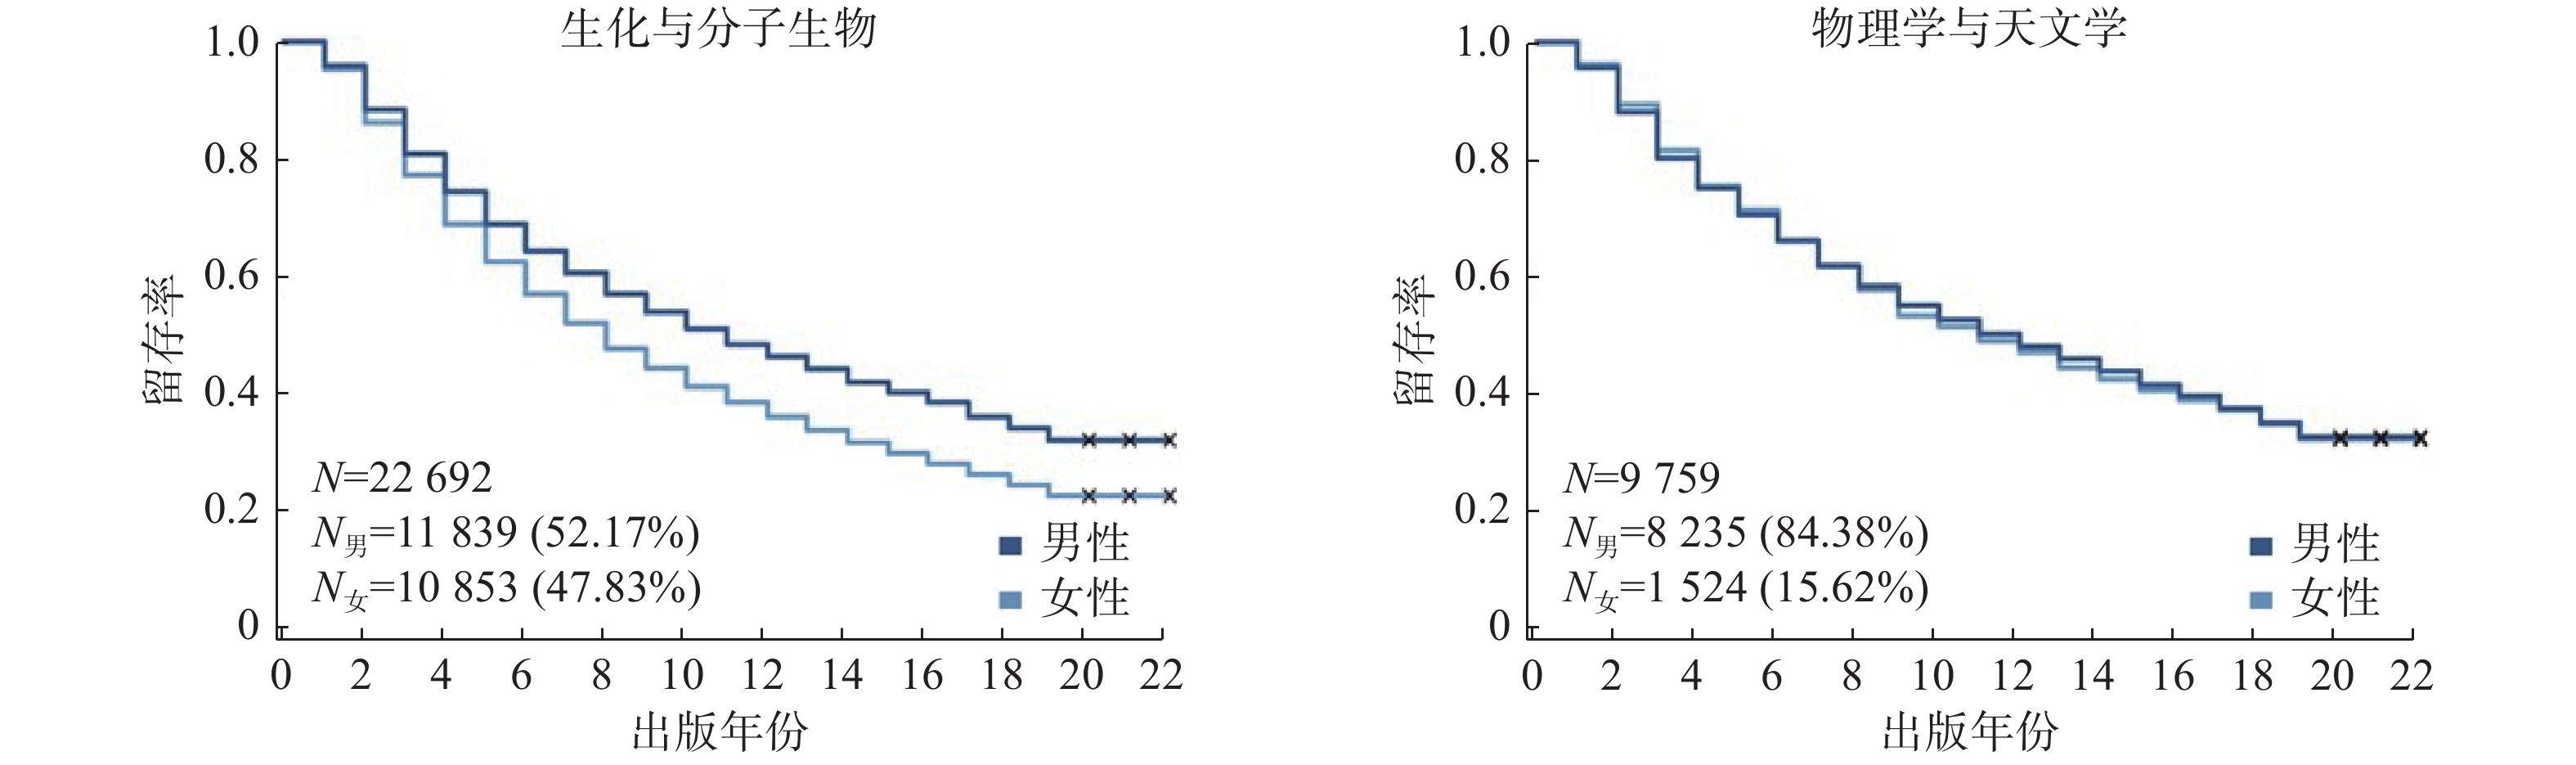
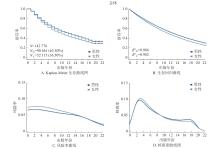
图 5
2000 年科学家队列(N=142,776),所有学科合并 A. Kaplan-Meier生存曲线图B.生存回归曲线(Kaplan-Meier指数分布拟合)C.风险率曲线(样条平滑法,平滑参数 10k)D.核密度曲线图(样条平滑法,带宽2,基于高斯曲线的每点分量)"
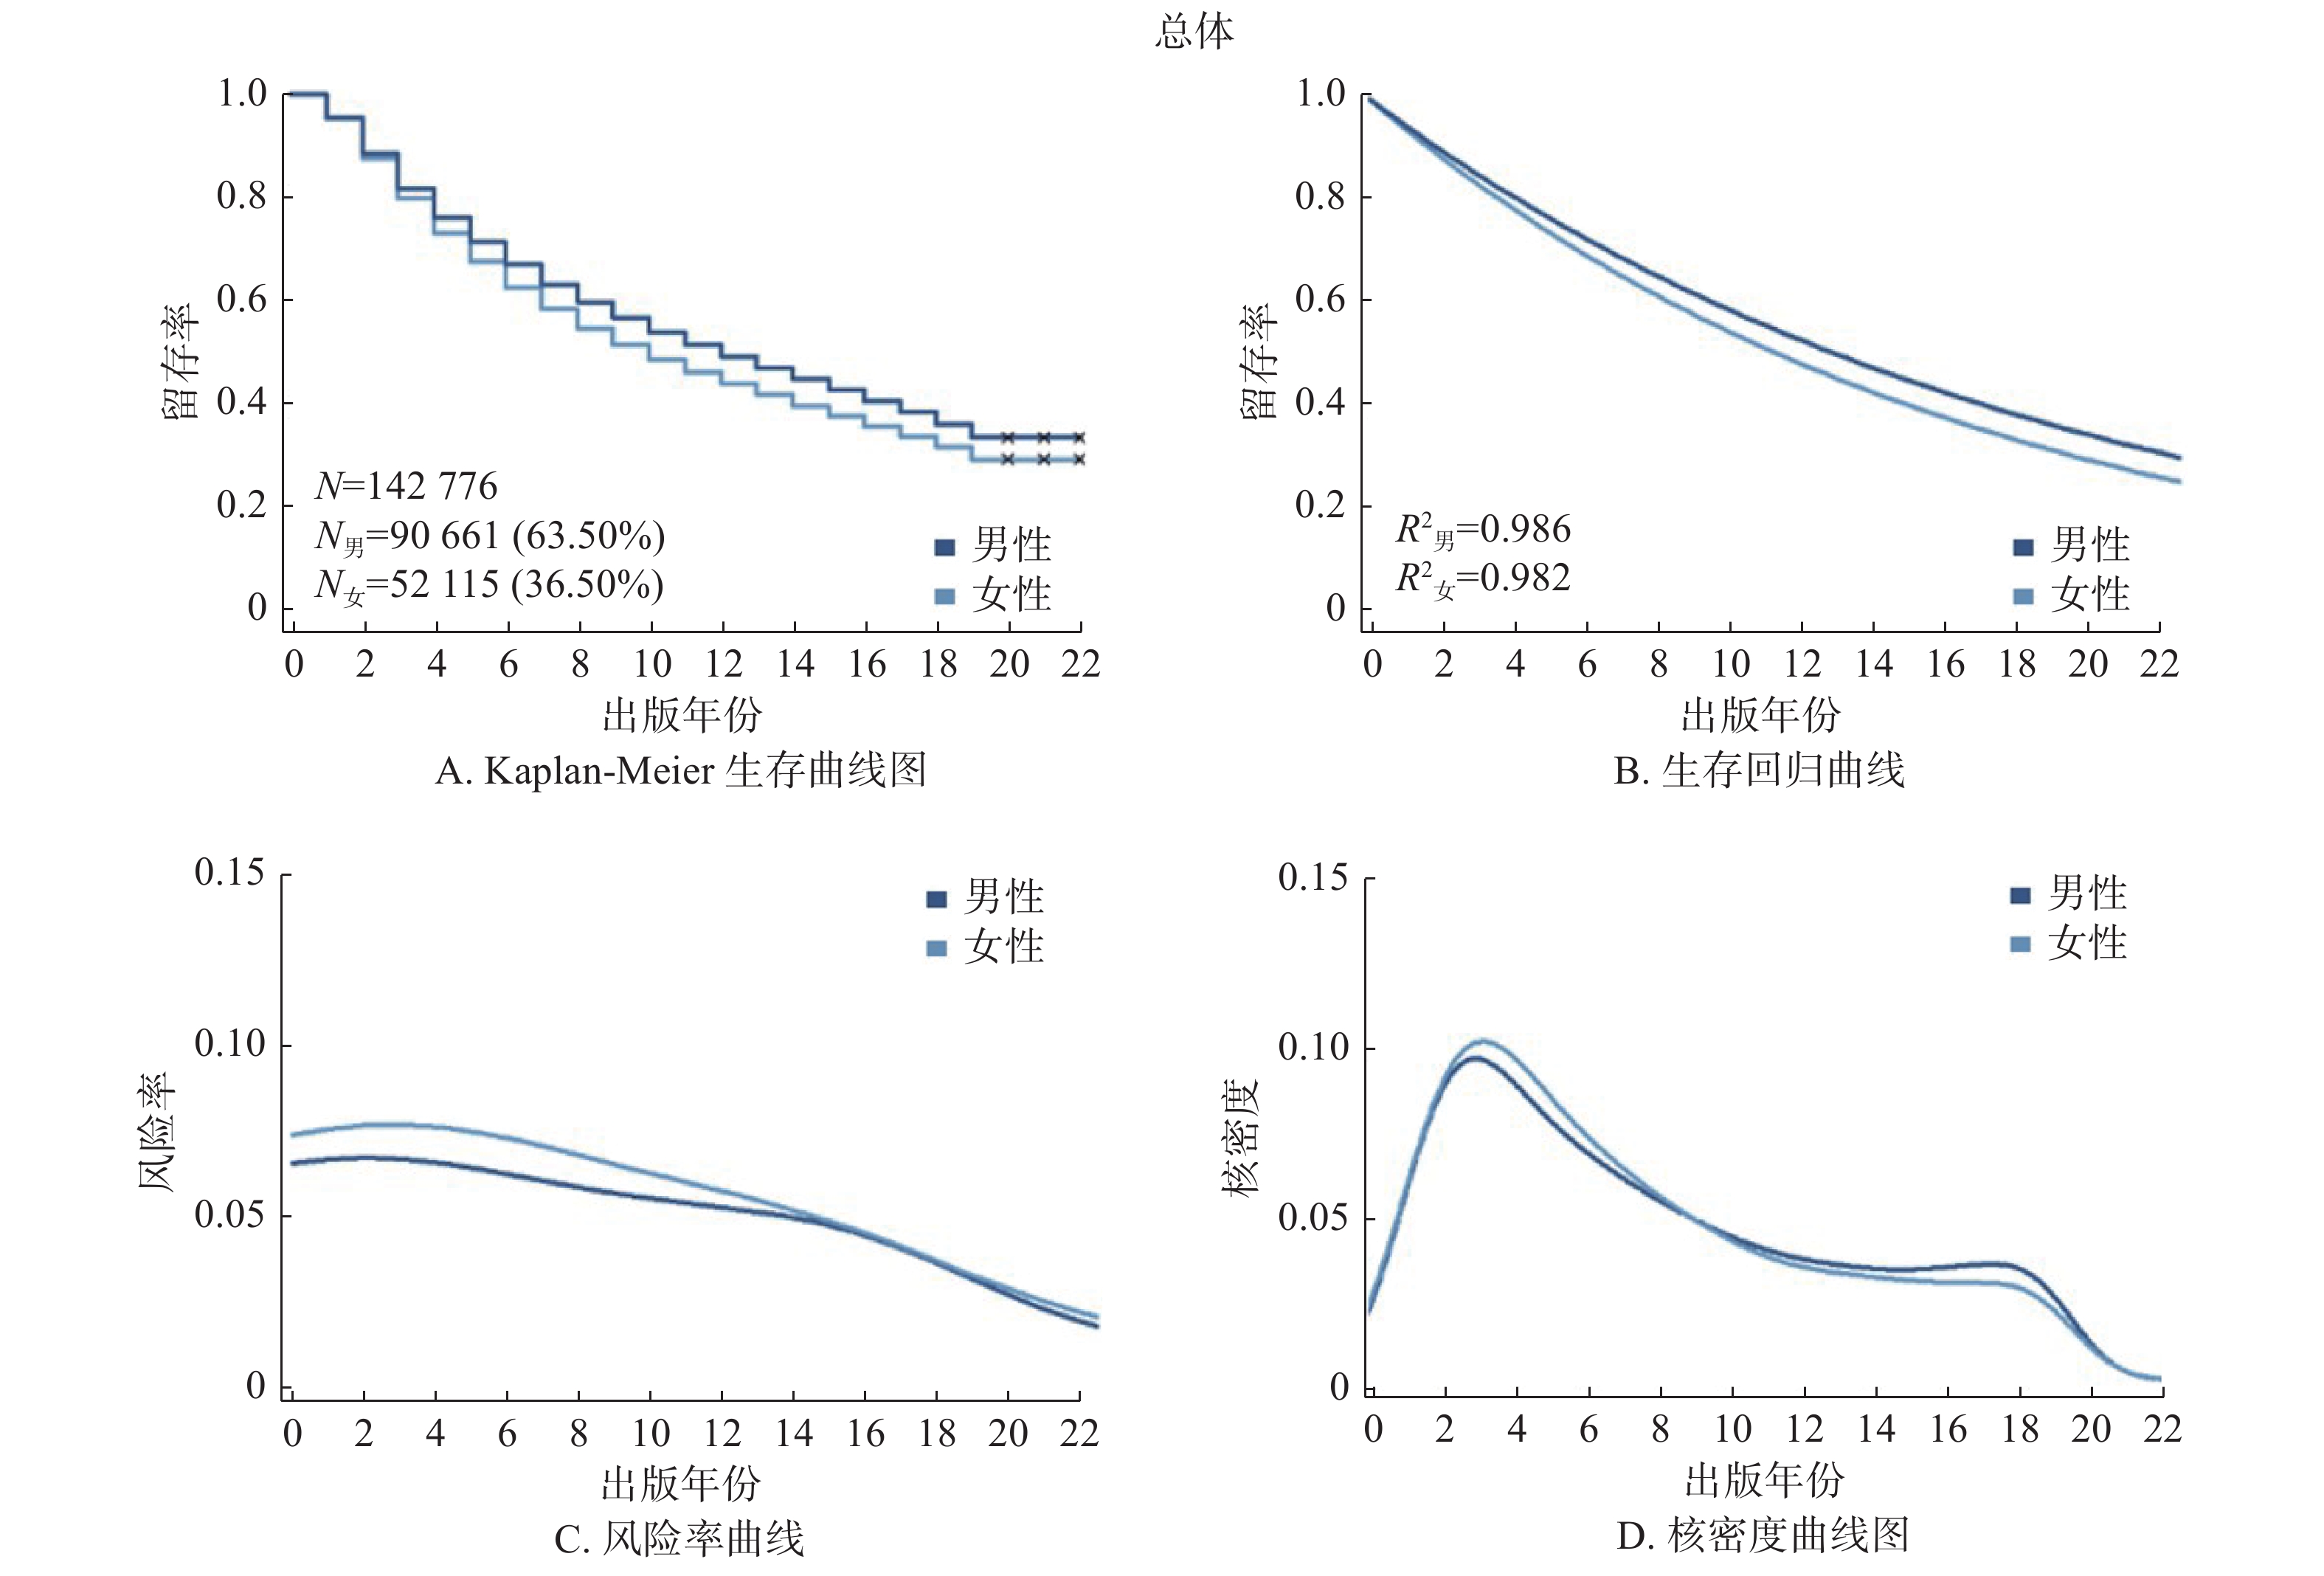
图 6
2010 年科学家队列(N=232,843),所有学科合并 A. Kaplan-Meier生存曲线图B.生存回归曲线(Kaplan-Meier指数分布拟合)C.风险率曲线(样条平滑法,平滑参数 10k)D.核密度曲线图(样条平滑法,带宽2,基于高斯曲线的每点分量)"
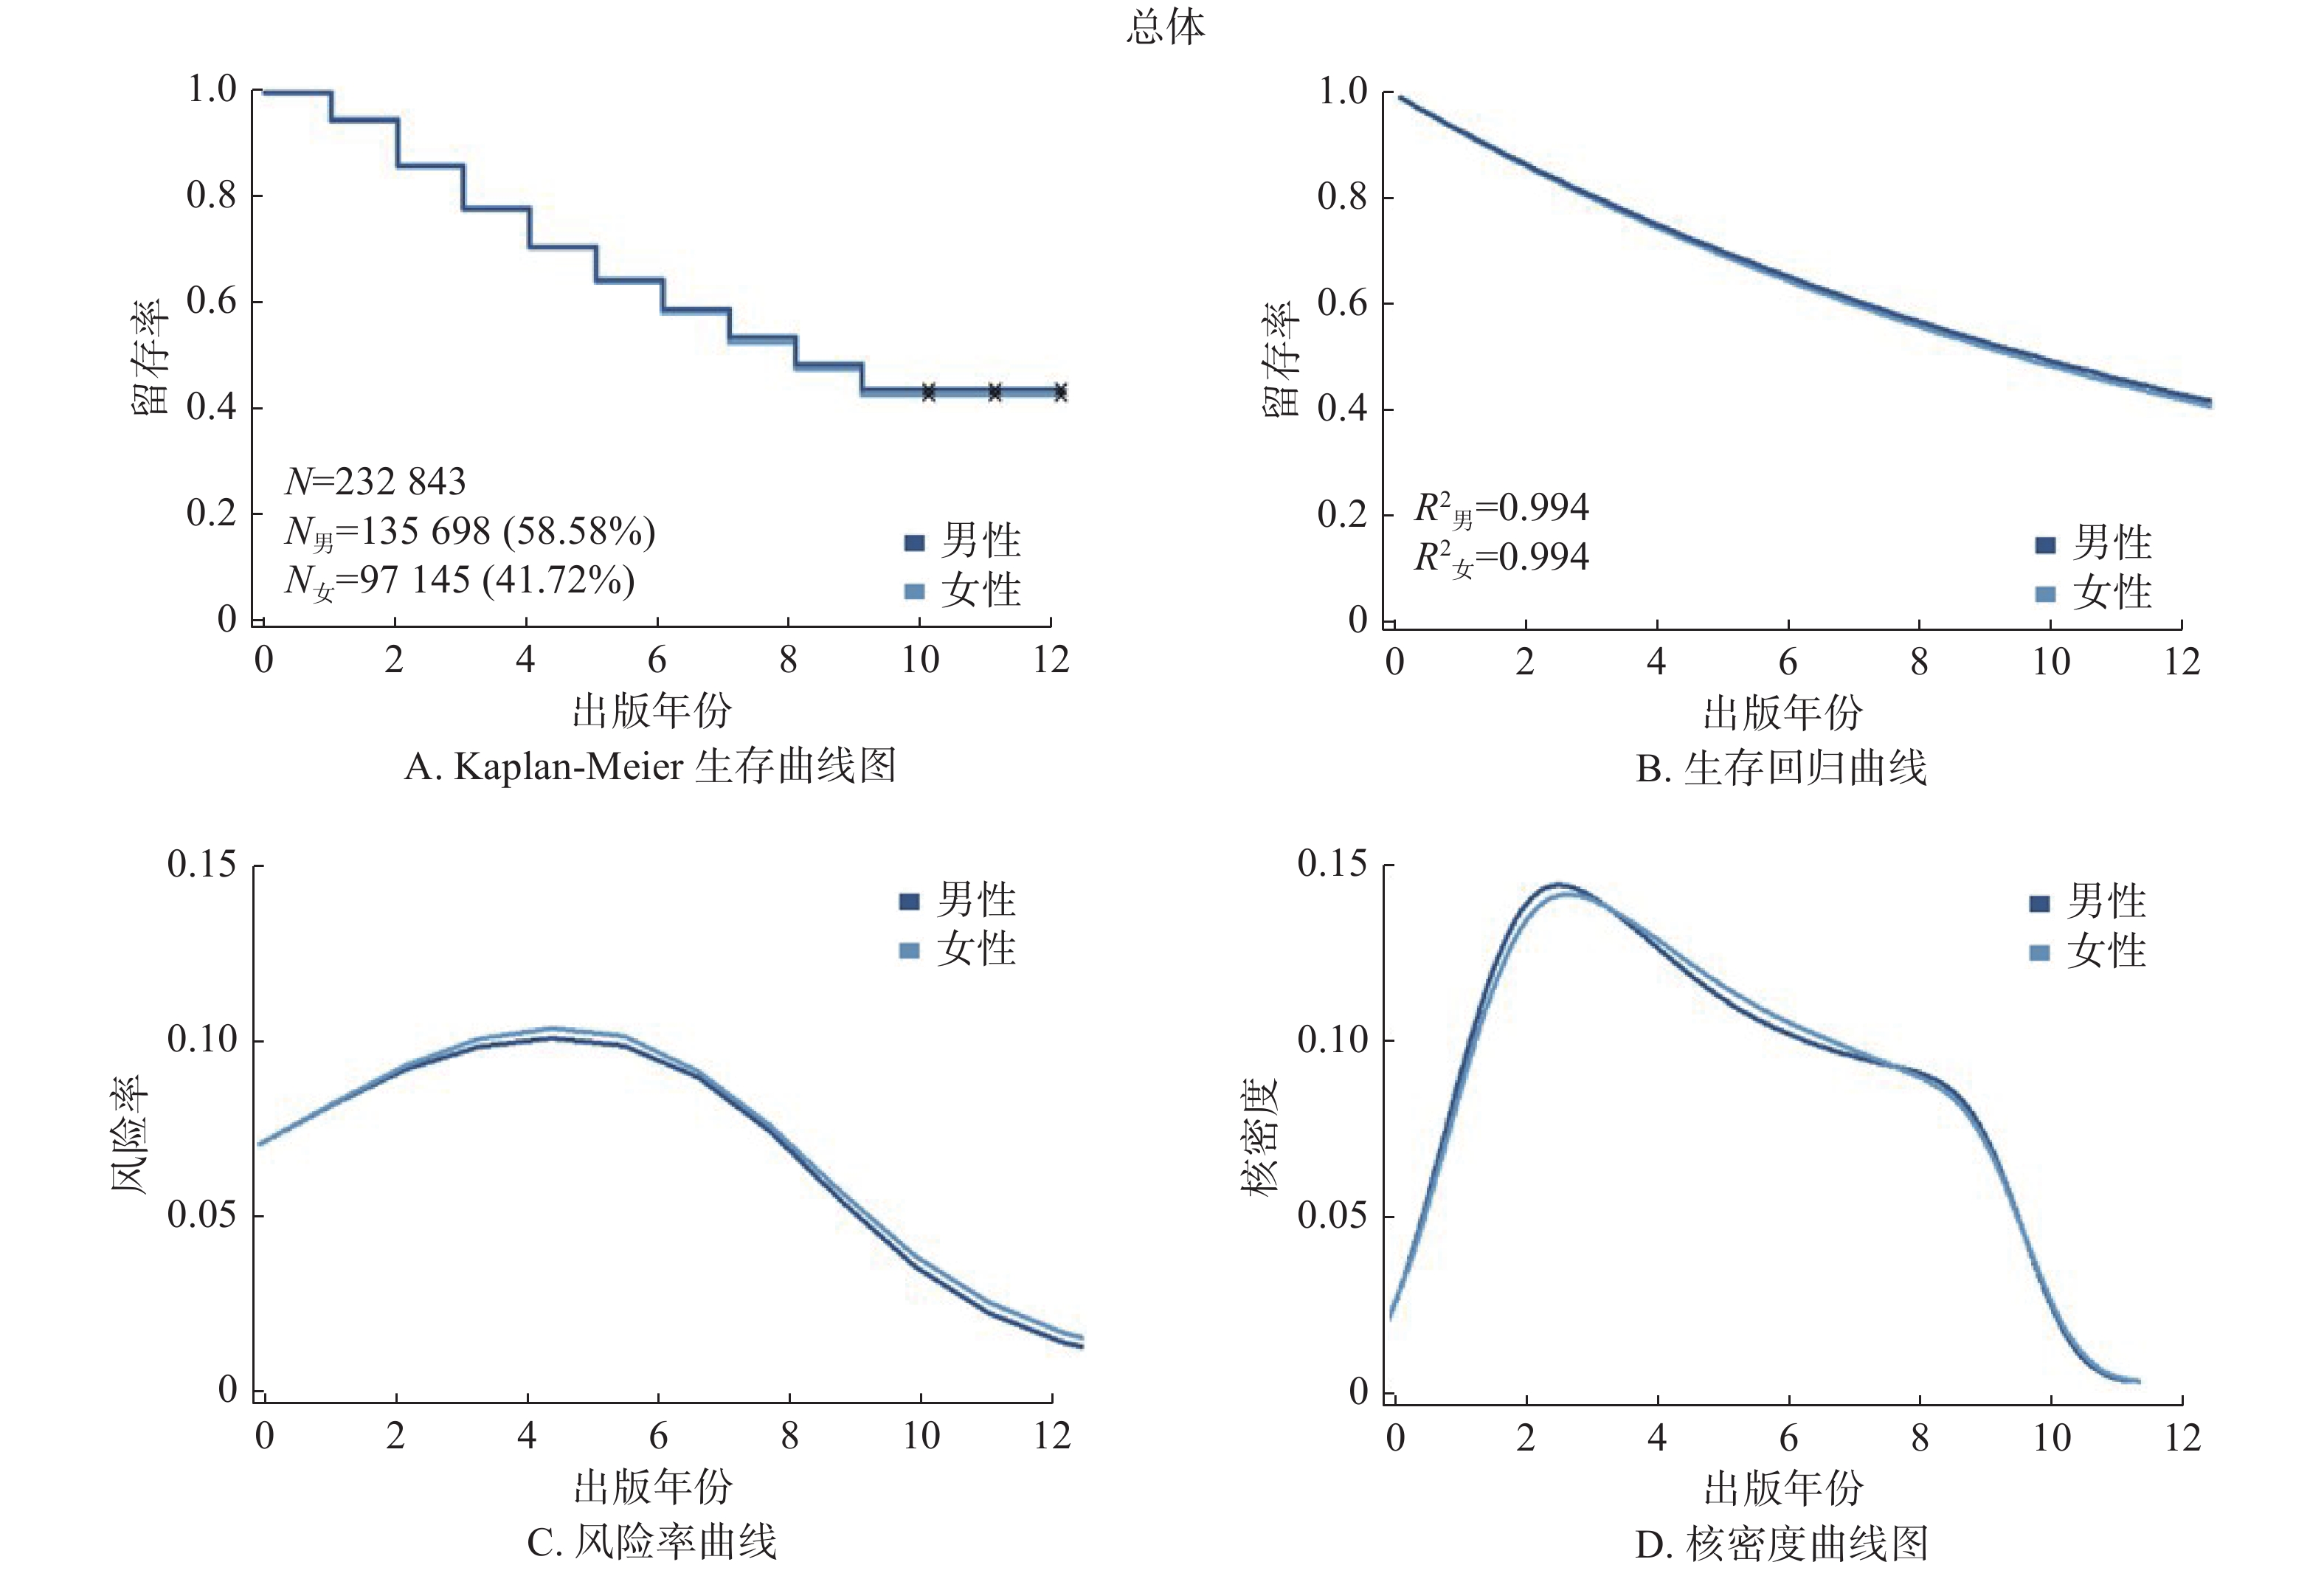
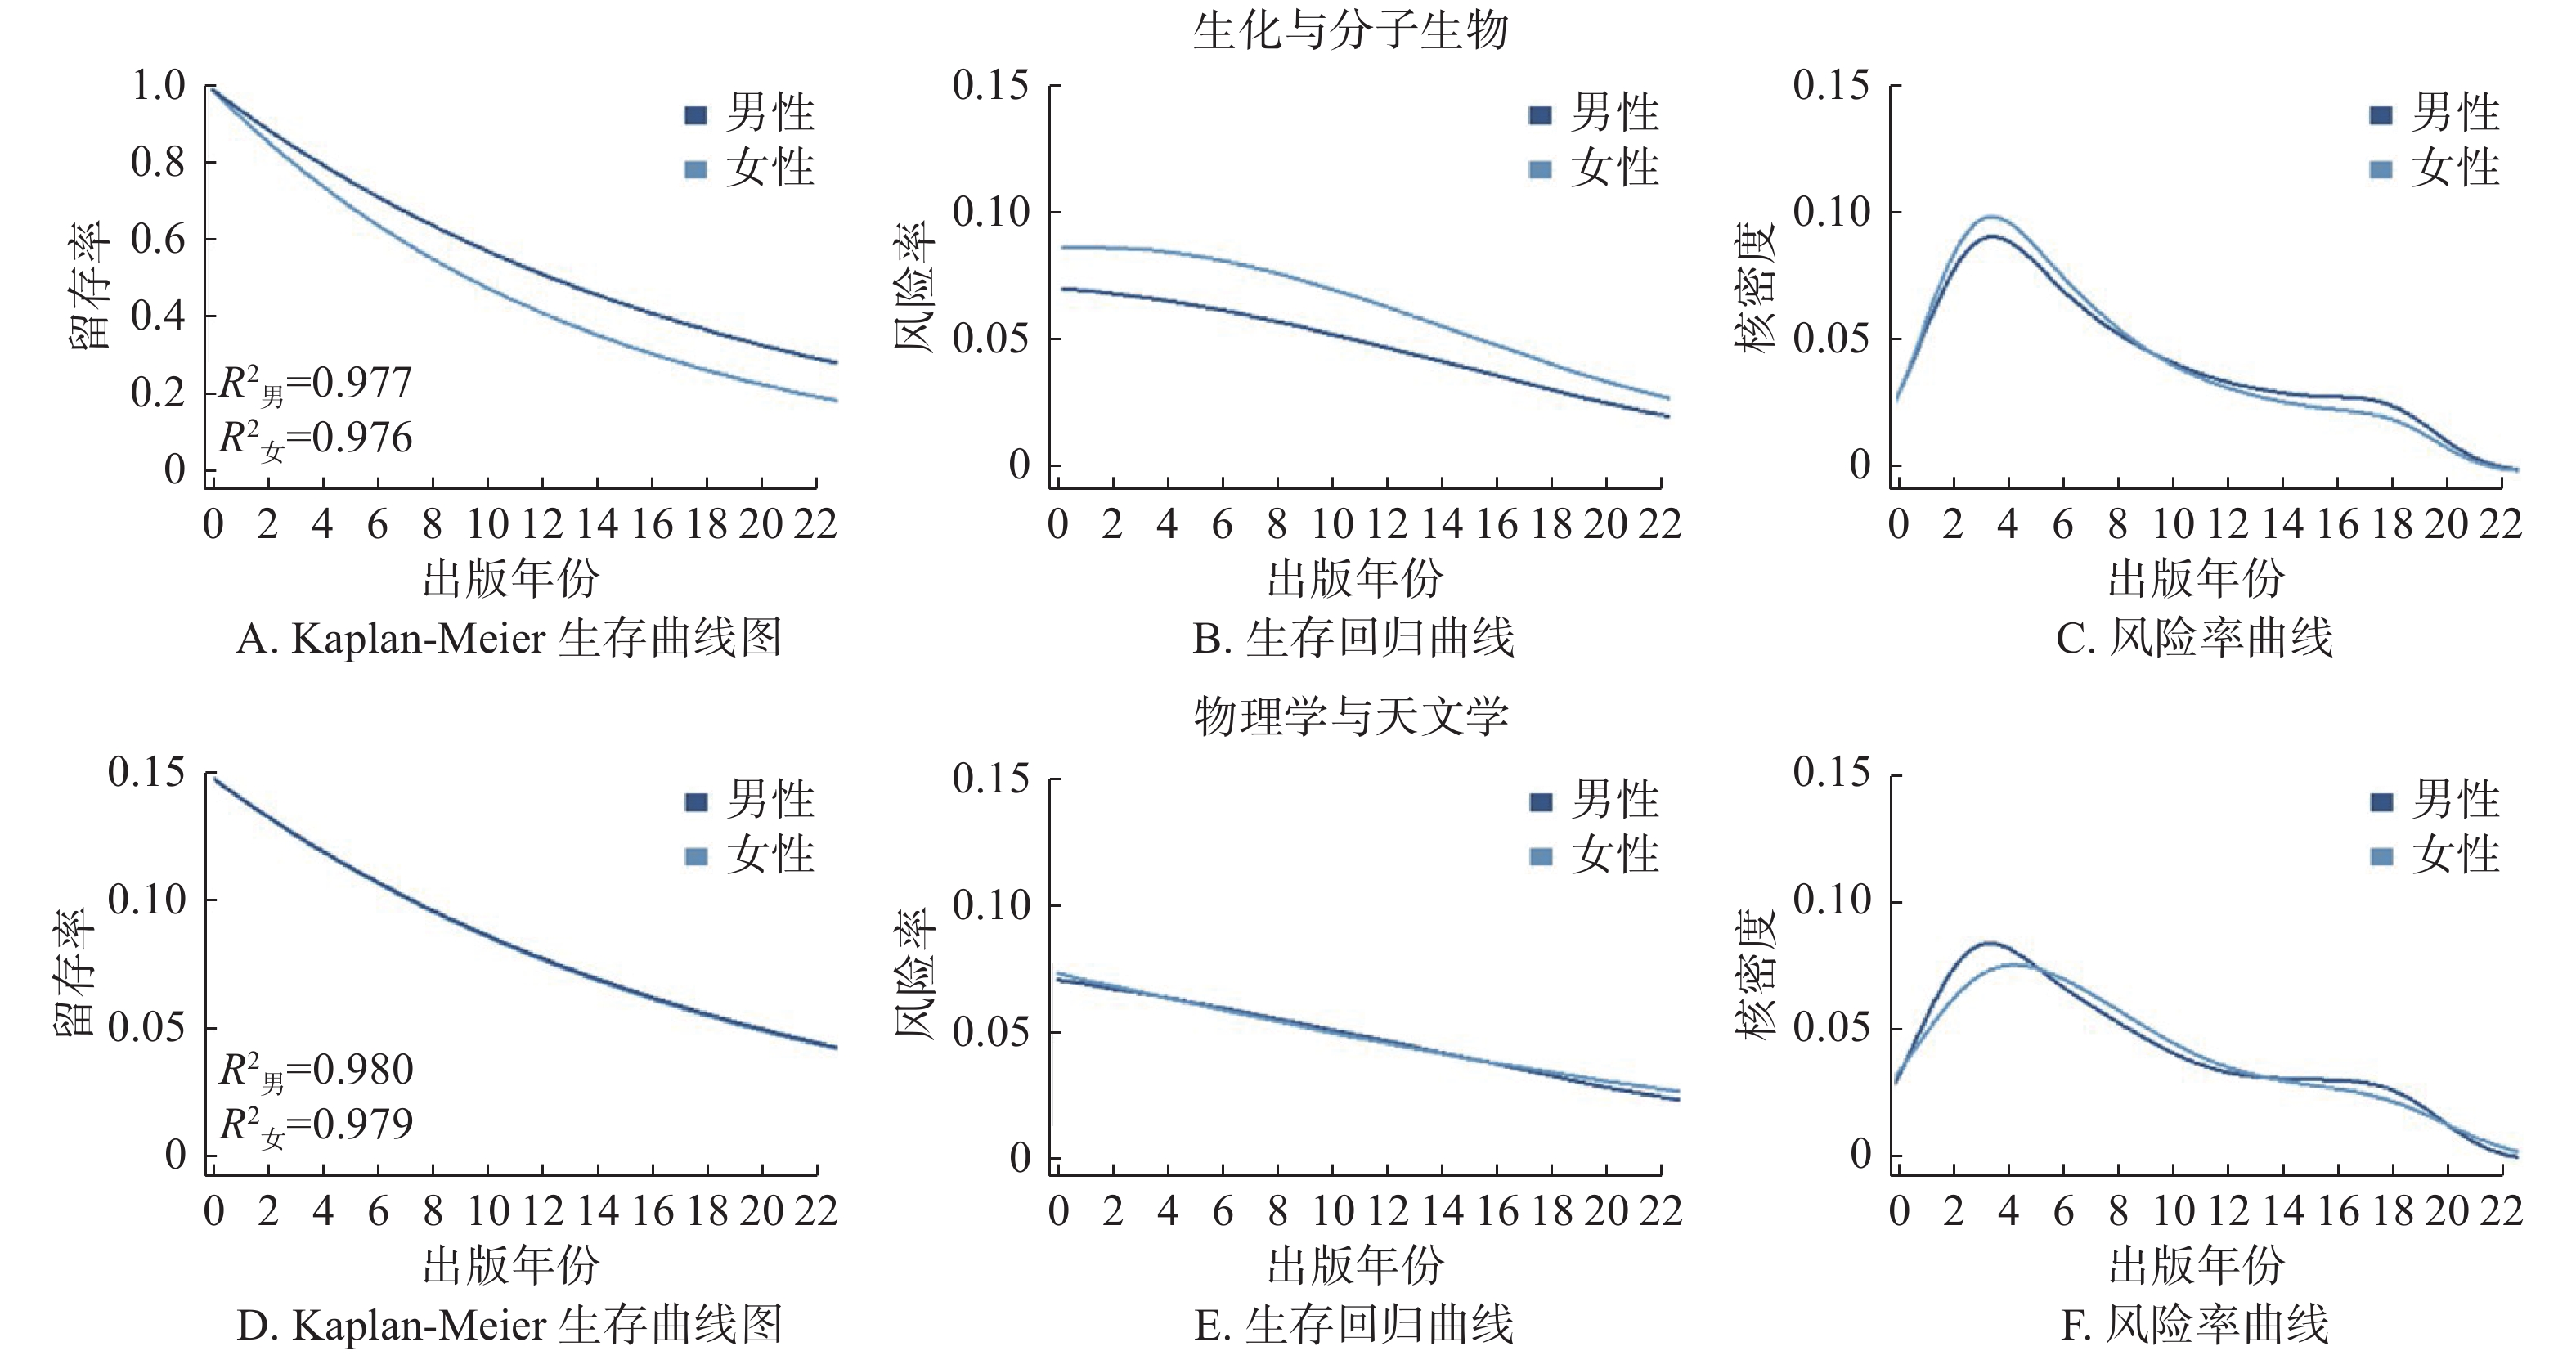
图 7
2000 年科学家队列中的生物(N=22,692)和物理(N=9,750) A. Kaplan-Meier生存曲线图B.生存回归曲线(Kaplan-Meier指数分布拟合)C.风险率曲线(样条平滑法,平滑参数 10k)D.核密度曲线图(样条平滑法,带宽2,基于高斯曲线的每点分量)"
| Alexopoulos, M., Lyons, K., Mahetaji, K., Barnes, M. E., & Gutwillinger, R. (2023). Gender inference: can chatGPT outperform common commercial tools?. arXiv preprint arXiv:2312.00805. | |
| Allison, P. D. (2014). Event history and survival analysis. Sage. | |
|
Baas, J., Schotten, M., Plume, A., Côté, G., & Karimi, R. (2020). Scopus as a curated, high-quality bibliometric data source for academic research in quantitative science studies. Quantitative Science Studies, 1 (1), 377- 386.
doi: 10.1162/qss_a_00019 |
|
| Blickenstaff, J. C. (2005). Women and science careers: Leaky pipeline or gender filter? Gender and Education, 17(4), 369—386. | |
| Branch, E. H. ed. (2016). Pathways, Potholes, and the Persistence of Women in Science. Reconsidering the Pipeline. Lexington Books. | |
| Branch, E. H. , & Alegria, S. (2016). Gendered Responses to Failure in Undergraduate Computing. Evidence, Contradictions, and New Directions. In: E. H. Branch (ed. ), Pathways, Potholes, and the Persistence of Women in Science. Reconsidering the Pipeline (p. 17-31). Lexington Books. | |
| Cornelius, R. , Constantinople, A. , & Gray, J. (1988). The chilly climate: Fact or artifact? The Journal of Higher Education, 59(5), 527—55. | |
| Deutsch, F. M. , & Yao, B. (2014). Gender differences in faculty attrition in the USA. Community, Work & Family, 17(4), 392—408. | |
| Ehrenberg, R. G., Kasper, H., & Rees, D. I. (1991). Faculty turnover in American colleges and universities. Economics of Education Review, 10 (2), 99- 110. | |
| Elsevier (2018). Gender in the global research landscape. Elsevier. | |
| Elsevier. (2020). The researcher journey through a gender lens. Elsevier. | |
| Fox, M. F. (2010). Women and Men Faculty in Academic Science and Engineering: Social-Organizational Indicators and Implications. American Behavioral Scientist, 53, 997- 1012. | |
| Fox, M. F., & Mohapatra, S. (2007). Social-organizational characteristics of work and publication productivity among academic scientists in doctoral-granting departments. The Journal of Higher Education, 78 (5), 542- 571. | |
| Fox, M. F. (2020). Gender, science, and academic rank: Key issues and approaches. Quantitative Science Studies, 1 (3), 1001- 1006. | |
| Fox, M. F. , & Xiao, W. (2013). Perceived Chances for Promotion Among Women Associate Professors in Computing: Individual, Departmental, and Entrepreneurial Factors. Journal of Technology Transfer 38: 135—152. | |
| Fox, M. F. , & Kline, K. (2016). Women Faculty in Computing. A Key Case of Women in Science. In: E. H. Branch (ed. ), Pathways, Potholes, and the Persistence of Women in Science. Reconsidering the Pipeline (p. 54-69). Lexington Books. | |
| Geuna, A. , & Shibayama, S. (2015). Moving out of academic research: Why do scientists stop doing research? In A. Geuna (Ed. ), Global mobility of research scientists (pp. 271–297). Elsevier. | |
| Glenn, Norval D. 2005. Cohort analysis. Thousand Oaks, CA: Sage | |
| Goulden, M., Mason, M. A., & Frasch, K. (2011). Keeping women in the science pipeline. The ANNALS of the American Academy of Political and Social Science, 638, 141- 162. | |
| Hammarfelt, B. (2017). Recognition and reward in the academy: Valuing publication oeuvres in biomedicine, economics and history. Aslib Journal of Information Management, 69 (5), 607- 623. | |
| Hu, Y., Hu, C., Tran, T., Kasturi, T., Joseph, E., & Gillingham, M. (2021). What’s in a name?–gender classification of names with character based machine learning models. Data Mining and Knowledge Discovery, 35(4), 1537—1563. | |
| Kaminski, D., & Geisler, C. (2012). Survival analysis of faculty retention in science and engineering by gender. Science, 335, 864- 866. | |
| Kanter, R. M. (1977). Some effects of proportions on group life: Skewed sex ratios and responses to token women. American Journal of Sociology, 82 (5), 965- 990. | |
| Karimi, F., Wagner, C., Lemmerich, F., Jadidi, M., & Strohmaier, M. (2016). Inferring gender from names on the web: A comparative evaluation of gender detection methods. In Proceedings of the 25th International conference companion on World Wide Web (pp. 53-54). | |
| Kashyap, R. , Rinderknecht, R. G. , Akbaritabar, A. , Alburez-Gutierrez, D. , Gil-Clavel, S. , Grow, A. , Zhao, X. (2023). Digital and computational demography. In: Research handbook on digital sociology, 48–86. Cheltenham: Edward Elgar Publishing. | |
| King, M. M. , Bergstrom, C. T. , Correll, S. J. , Jacquet, J. , & West, J. D. (2017). Men set their own cites high: Gender and self-citation across fields and over time. Socius, 3. | |
| Kwiek, M. (2016). The European research elite: A cross-national study of highly productive academics across 11 European systems. Higher Education, 71 (3), 379- 397. | |
| Kwiek, M. (2018). High research productivity in vertically undifferentiated higher education systems: Who are the top performers? Scientometrics. Vol. 115(1). 415—462. | |
| Kwiek, M., & Roszka, W. (2021a). Gender disparities in international research collaboration: A large-scale bibliometric study of 25, 000 university professors. Journal of Economic Surveys, 35 (5), 1344- 1388. | |
| Kwiek, M., & Roszka, W. (2021b). Gender-based homophily in research: A large-scale study of man-woman collaboration. Journal of Informetrics, 15 (3), 1- 38. | |
| Kwiek, M., & Roszka, W. (2022). Are female scientists less inclined to publish alone? The gender solo research gap. Scientometrics, 127, 1697- 1735. | |
| Kwiek, M. , & Szymula, L. (2024). Quantifying attrition in science: A cohort-based, longitudinal study of scientists in 38 OECD countries. Higher Education, 1–29. Online first: https://doi.org/10.1007/s10734-024-01284-0. | |
| Kyvik, S. (1990). Age and scientific productivity. Differences between fields of learning. Higher Education, 19(1), 37—55. | |
| Larivière, V., Ni, C., Gingras, Y., Cronin, B., & Sugimoto, C. R. (2013). Bibliometrics: Global gender disparities in science. Nature, 504 (7479), 211- 213. | |
| Liu, L., Jones, B. F., Uzzi, B., et al. (2023). Data, measurement, and empirical methods in the science of science. Nature Human Behaviour, 7, 1046- 1058. | |
| Loannidis, J. P. A., Boyack, K. W., & Klavans, R. (2014). Estimates of the continuously publishing core in the scientific workforce. PLOS One, 9 (7), e101698. | |
| Maranto, C. L., & Griffin, A. E. (2011). The antecedents of a “chilly climate” for women faculty in higher education. Human Relations, 64 (2), 139- 159. | |
| Mills, M. (2011). Introducing survival and event history analysis. Sage. | |
| Milojevic, S., Radicchi, F., & Walsh, J. P. (2018). Changing demographics of scientific careers: The rise of the temporary workforce. Proceedings of the National Academy of Sciences, 115, 12616- 12623. | |
| NamSor (2024). NamSor API documentation available from https://namsor.app/api-documentation/. | |
| Nane, G. F., Larivière, V., & Costas, R. (2017). Predicting the age of researchers using bibliometric data. Journal of informetrics, 11(3), 713—729. | |
| Nielsen, M. W., & Andersen, J. P. (2021). Global citation inequality is on the rise. Proceedings of the National Academy of Sciences, 118 (7), e2012208118. | |
| Nygaard, L. P., Piro, F., & Aksnes, D. (2022). Gendering excellence through research productivity indicators. Gender and Education, 34 (6), 690- 704. | |
| Pelz, D. C., & Andrews, F. M. (1976). Scientists in organizations: Productive climates for research and development. New York: Wiley. | |
| Peters, S. A., & Norton, R. (2018). Sex and gender reporting in global health: new editorial policies. BMJ global health, 3(4). | |
| Preston, A. E. (2004). Leaving science. Occupational exit from scientific careers. Russell Sage Foundation. | |
| Priem, J., Piwowar, H., & Orr, R. (2022). OpenAlex: A fully-open index of scholarly works, authors, venues, institutions, and concepts. arXiv preprint arXiv:2205.01833. | |
| Radicchi, F., & Castellano, C. (2013). Analysis of bibliometric indicators for individual scholars in a large data set. Scientometrics, 97, 627—637. | |
| Robinson-Garcia, N., Costas, R., Sugimoto, C. R., Larivière, V., & Nane, G. F. (2020). Task specialization across research careers. Elife, 9, e60586. | |
| Rosser, V. J. (2004). Faculty members’ intentions to leave: A national study on their work-life and satisfaction. Research in Higher Education, 45 (3), 285- 309. | |
| Santos, J. M. , Horta, H. , & Amâncio, L. (2020). Research agendas of female and male academics: A new perspective on gender disparities in academia. Gender and Education, 1—19. | |
| Santamaría, L., & Mihaljević, H. (2018). Comparison and benchmark of name-to-gender inference services. PeerJ Computer Science, 4, e156. | |
| Salganik, M. J. (2018). Bit by bit: Social research in the digital age. Princeton University Press. | |
| Savage, W. E., & Olejniczak, A. J. (2021). Do senior faculty members produce fewer research publications than their younger colleagues? Evidence from Ph. D. granting institutions in the United States. Scientometrics, 126(6), 4659—4686. | |
| Science-Metrix (2018). Analytical Support for Bibliometrics Indicators. Development of bibliometric indicators to measure women’s contribution to scientific publications. Final Report. Science-Metrix. | |
| Shaw, A. K., & Stanton, D. E. (2012). Leaks in the pipeline: Separating demographic inertia from ongoing gender differences in academia. Proceedings of the Royal Society B. Biological Sciences, 279 (1743), 3736- 3741. | |
| Shibayama, S., & Baba, Y. (2015). Impact-oriented science policies and scientific publication practices: The case of life sciences in Japan. Research Policy, 44 (4), 936- 950. | |
| Singer, J. D. , & Willett, J. B. (2003). Applied Longitudinal Data Analysis. Modeling Change and Event Occurrence. Oxford: Oxford University Press. | |
| Smart, J. C. (1990). A causal model of faculty turnover intentions. Research in Higher Education, 31 (5), 405- 424. | |
|
Spoon K., LaBerge N., Wapman K. H., Zhang S., Morgan A. C., Galesic M., Fosdick B. K., Larremore D. B., Clauset A. (2023). Gender and retention patterns among U. S. faculty. Science Advances, 9, eadi2205.
doi: 10.1126/sciadv.adi2205 |
|
| Stephan, P. E., & Levin, S. G. (1992). Striking the mother lode in science: The importance of age, place, and time. New York: Oxford University Press. | |
| Stephan, P. E. (2012). How economics shapes science. Harvard University Press. | |
| Sugimoto, C. , & Larivière, V. (2023). Equity for women in science: Dismantling systemic barriers to advancement. Harvard University Press. | |
| Tang, L. , & Horta, H. (2023). Supporting academic women’s careers: Male and female academics’ perspectives at a Chinese research university. Minerva. https://doi.org/10.1007/s11024-023-09506-y. | |
| Van den Besselaar, P., & Sandström, U. (2016). Gender differences in research performance and its impact on careers: a longitudinal case study. Scientometrics, 106, 143—162. | |
| Wang, D. , & Barabási, A. -L. (2021). The science of science. Cambridge University Press. | |
| Wais, K. (2016). Gender prediction methods based on first names with genderizeR. The R Journal 8(1): 17—37. | |
| West, J. D., Jacquet, J., King, M. M., Correll, S. J., & Bergstrom, C. T. (2013). The role of gender in scholarly authorship. PloS one, 8(7), e66212. | |
| White-Lewis, D. K., O’Meara, K., Mathews, K., et al. (2023). Leaving the institution or leaving the academy? Analyzing the factors that faculty weigh in actual departure decisions. Research in Higher Education, 64, 473- 494. | |
| Wohrer, V. (2014). To stay or to go? Narratives of early-stage sociologists about persisting in academia. Higher Education Policy, 27, 469- 487. | |
| Xie, Y. , & Shauman, K. A. (2003). Women in Science: Career Processes and Outcomes. Harvard University Press. | |
| Xu, Y. J. (2008). Gender disparity in STEM disciplines: A study of faculty attrition and turnover intentions. Research in Higher Education, 49, 607- 624. | |
| Zhou, Y., & Volkwein, J. F. (2004). Examining the influence on faculty departure intentions: A comparison of tenured versus nontenured faculty at research universities using NSOPF-99. Research in Higher Education, 45 (2), 139- 176. |
| [1] | 郑永和, 周丹华, 张永和, 田雪葳, 王晶莹, 郑一. 计算教育学视域下的ChatGPT:内涵、主题、反思与挑战[J]. 华东师范大学学报(教育科学版), 2023, 41(7): 91-102. |
| [2] | 张广斌, 薛克勋. 数字教育学的底层逻辑与构建路径——兼论中国式数字教育学建设[J]. 华东师范大学学报(教育科学版), 2023, 41(11): 67-84. |
| [3] | 薛海平, 师欢欢. 起跑线竞争:我国中小学生首次参与课外补习时间分析——支持“双减”政策落实的一项实证研究[J]. 华东师范大学学报(教育科学版), 2022, 40(2): 71-89. |
| [4] | 杨欣. 教育评价改革的算法追问[J]. 华东师范大学学报(教育科学版), 2022, 40(1): 19-29. |
| [5] | 郑永和, 严晓梅, 王晶莹, 王杨春晓, 刘士玉. 计算教育学论纲:立场、范式与体系[J]. 华东师范大学学报(教育科学版), 2020, 38(6): 1-19. |
| [6] | 唐汉卫, 张姜坤. 大数据教育应用的限度[J]. 华东师范大学学报(教育科学版), 2020, 38(10): 60-68. |
| [7] | 柯政. 高考改革需要更加重视科学学科[J]. 华东师范大学学报(教育科学版), 2018, 36(3): 13-24+166. |
| [8] | 赵伶俐. 以目标与课程为支点的美育质量测评——为了有效实施《国务院办公厅关于全面加强和改进学校美育工作的意见》[J]. 华东师范大学学报(教育科学版), 2017, 35(5): 87-99+161. |
| [9] | 姜勇, 戴乃恩. 论“基于证据”的教育研究的限度——“文化存在论教育学”的视角[J]. 华东师范大学学报(教育科学版), 2017, 35(3): 72-79+170. |
| 阅读次数 | ||||||
|
全文 |
|
|||||
|
摘要 |
|
|||||